Last tutorial in our LED trilogy! If you haven't - then check out our Light It Up!-LED Tutorial and CEED Universe Compass Tutorial.
Components needed:
- ADS1115 x 1
- LDR x 1
- LED x 1
- 510 kΩ Resistor x 1
- 5 Ω Resistor x 1
- Wires x 11
- pi-topPROTO board x 1
Background: This project was created with hearts in mind. It demonstrates and reveals a technique to measure the heart rate by sensing the change in blood volume in a finger artery while your heart is pumping! Compared to our last two tutorials, it is a bit more complex; however, it is perfect for an inter-curricular class or a fun family project for the weekend.
Step 1: In this tutorial you will learn to make a heart-rate-monitor with an LED circuit on the pi-topPROTO board.
Step 2: The diagram below illustrates how the components should be soldered onto the pi-topPROTO board:
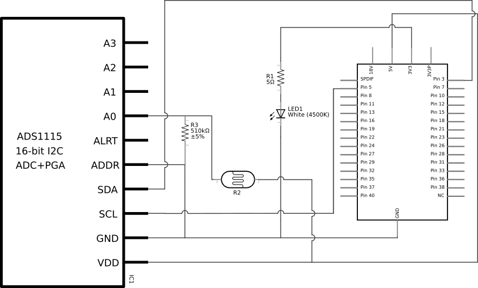
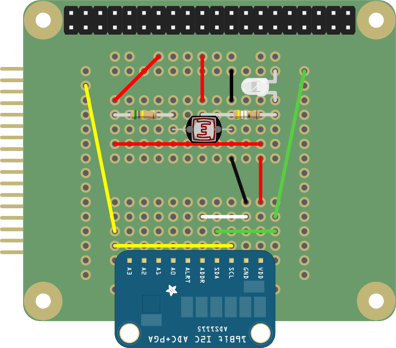
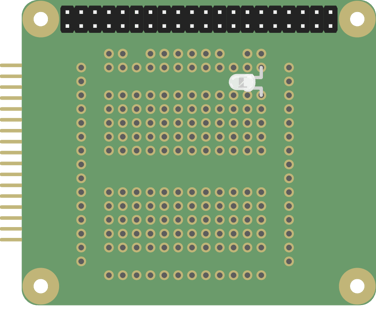
Step 3: To build this circuit on the pi-topPROTO board, solder the LED to the board.
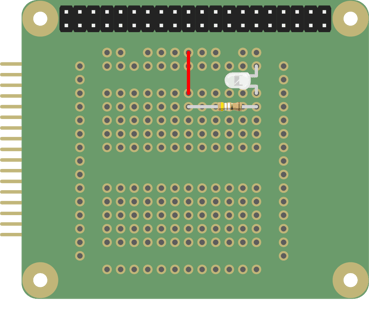
Step 4: Next solder in the resistor and complete the circuit using a wire.
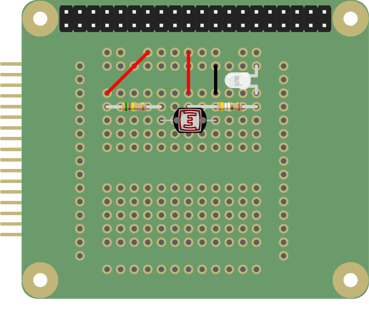
Step 5: Now solder in the LDR (Light Dependent Resistor), its accompanying resistor and complete the circuit using another wire.
Step 6: The next step is to solder in the analogue to digital signal converter (ads1115) into the pi-topPROTO board.
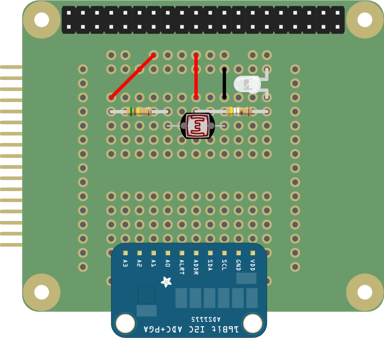
Step 7: Connect the ads1115 to the 5V power supply.
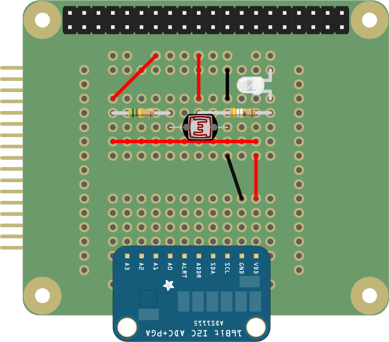
Step 8: Connect I2C connections (SCL and SDA) on the ads1115 to pin 5 and pin 3 on the board respectively.
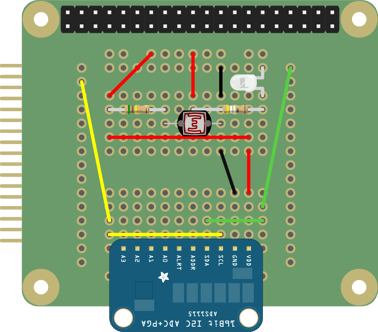
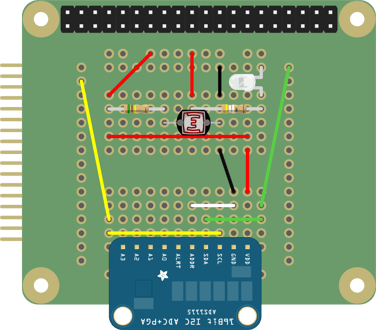
Step 9: Connect the ADDR pin to the GND pin on the ads1115 so as to define the I2C address on the ads1115 as 0x48.
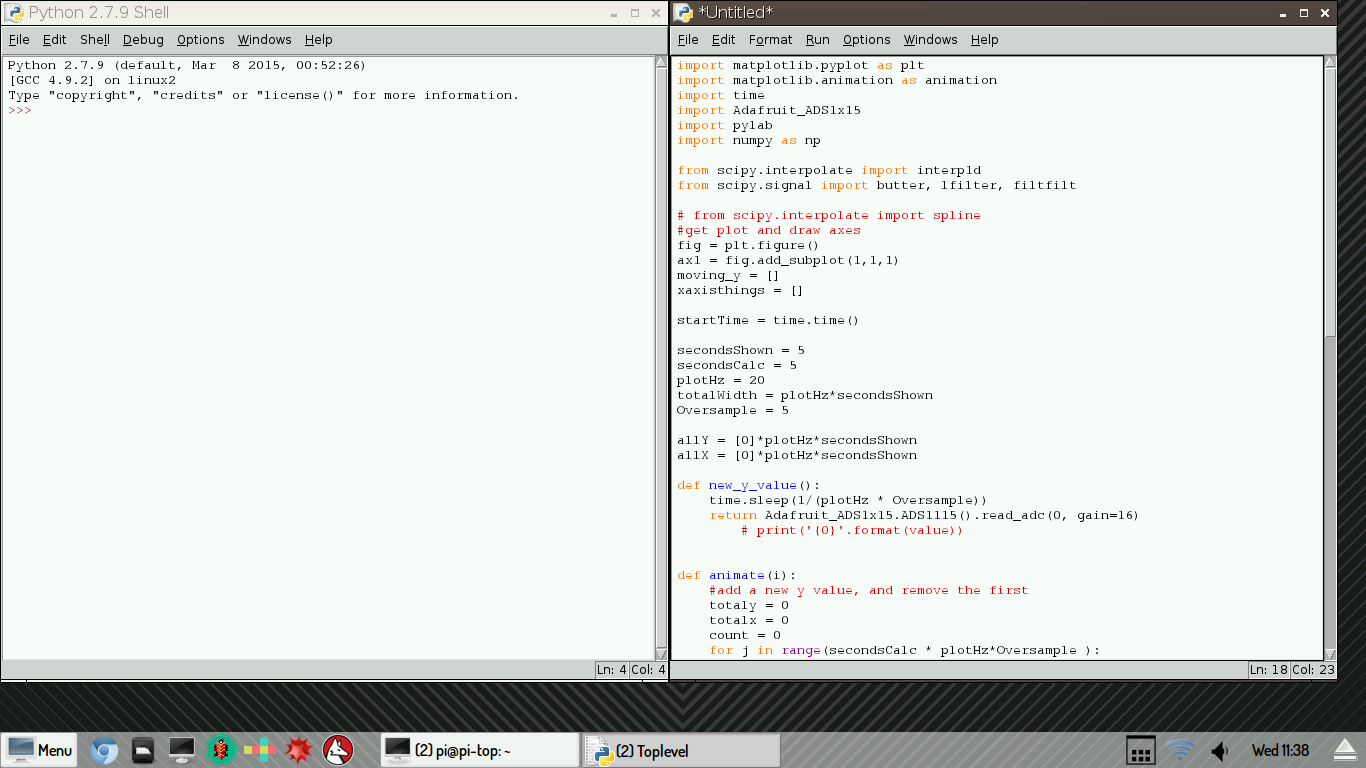
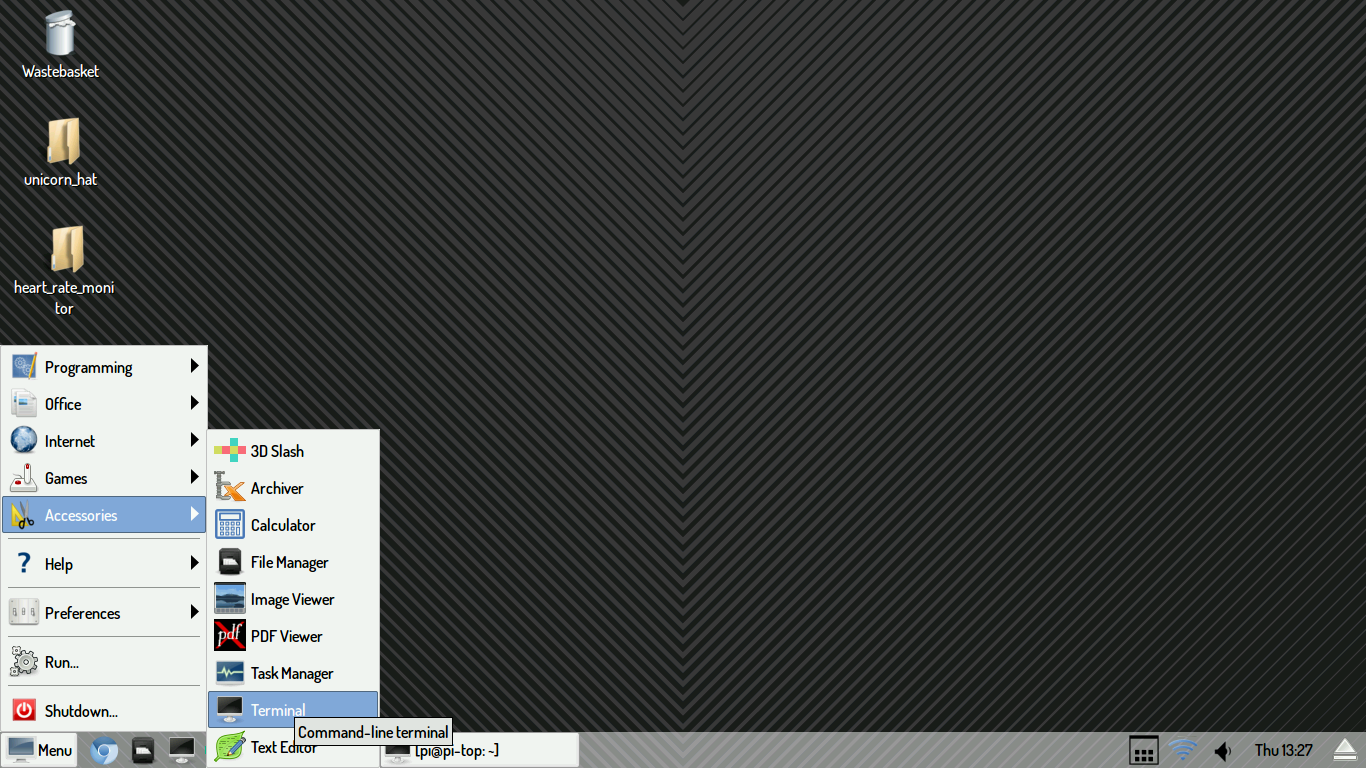
Step 10: The next step is to move onto the python code! This can be done on your pi-topCEED. After you have booted your pi-topCEED up: click on the Main Menu, accessories and then open up a terminal window as seen in the screenshot below.
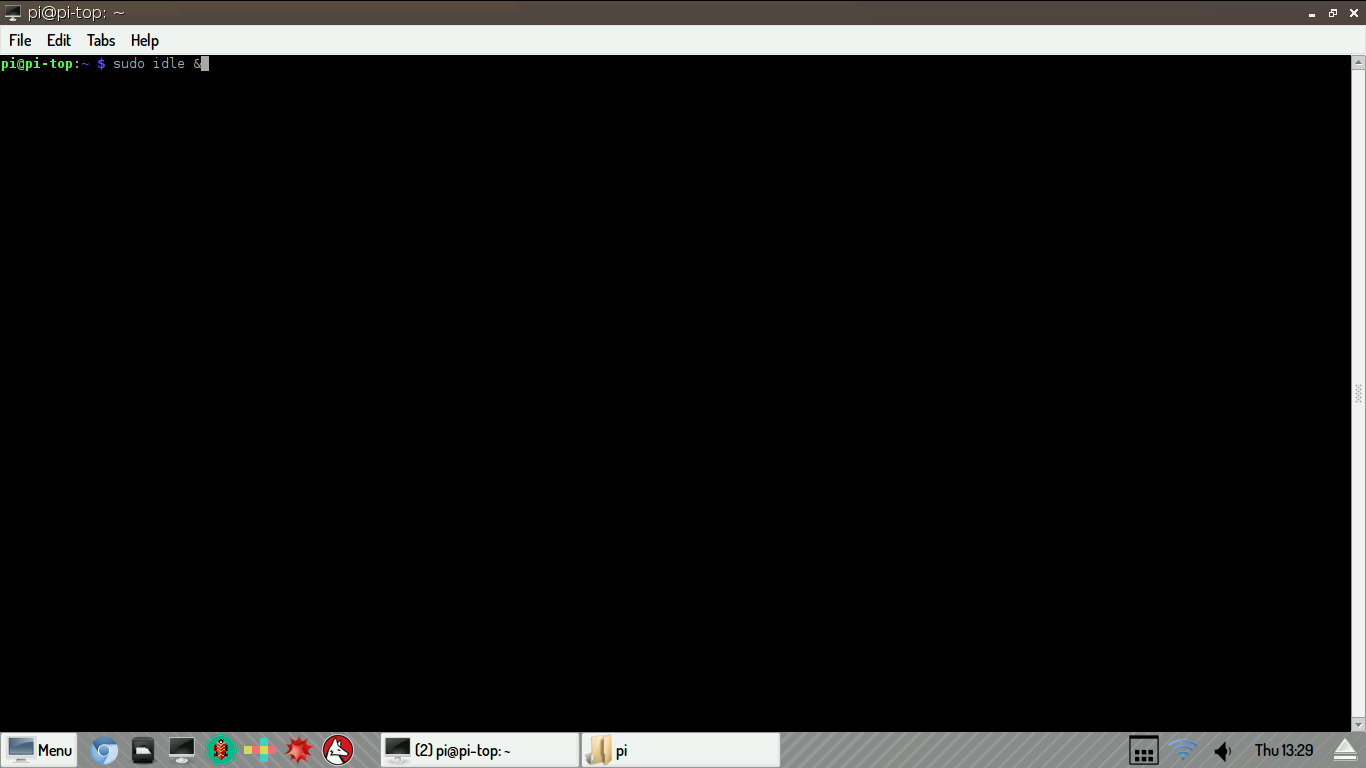
Step 11: Type in “sudo idle &” into the terminal to open up idle 2 which will allow you to create a run python scripts on the Raspberry Pi!
Step 12: Once the python shell environment has opened up, click File and then New to open up a new text editor. This text editor is where you will type your code, save and run the project! Once you run the project on the text editor the results will be displayed on the python shell environment that was previously mentioned.
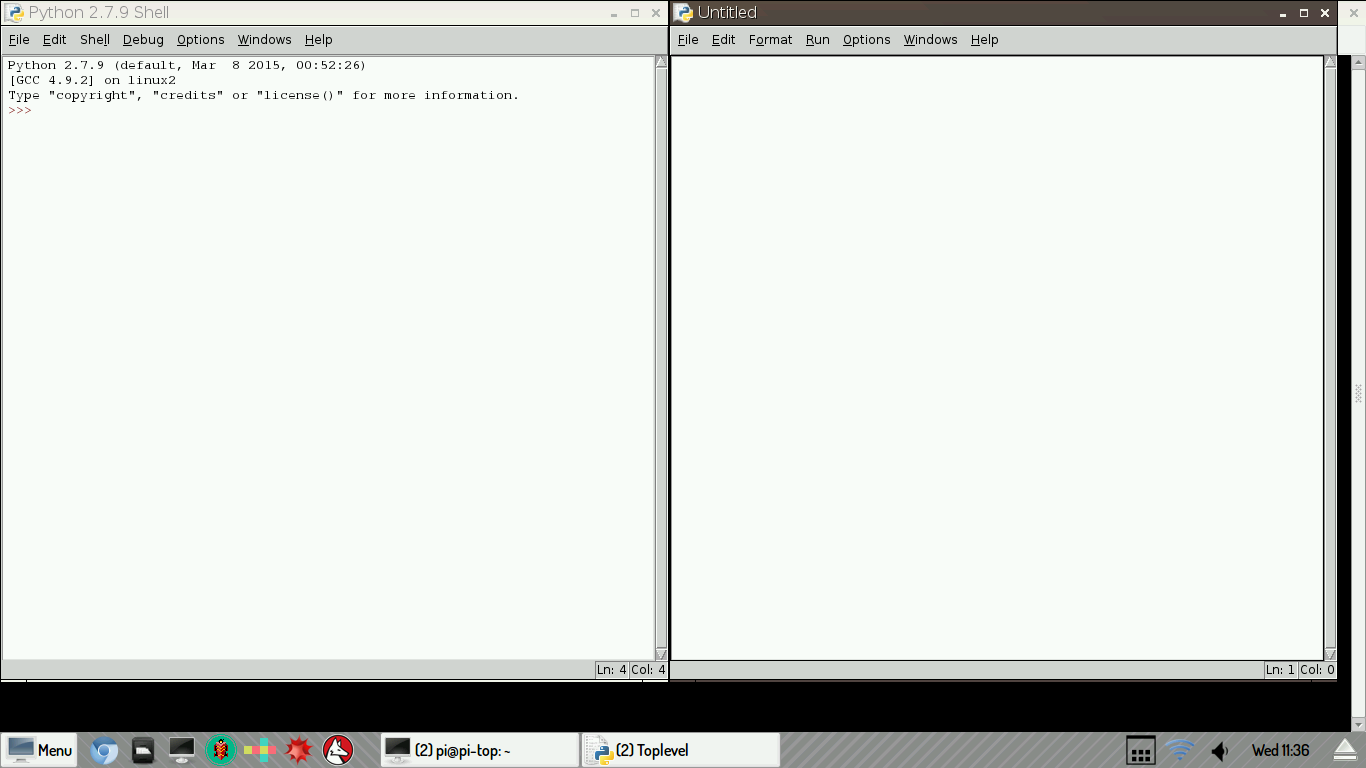
Step 13: The next step is to now copy the code below in the python text editor:
import matplotlib.pyplot as pltimport matplotlib.animation as animation
import time
import Adafruit_ADS1x15
import pylab
import numpy as np
from scipy.interpolate import interp1d
from scipy.signal import butter, lfilter, filtfilt
# from scipy.interpolate import spline
#get plot and draw axes
fig = plt.figure()
ax1 = fig.add_subplot(1,1,1)
moving_y = []
xaxisthings = []
startTime = time.time()
secondsShown = 5
secondsCalc = 5
plotHz = 20
totalWidth = plotHz*secondsShown
Oversample = 5
allY = [0]*plotHz*secondsShown
allX = [0]*plotHz*secondsShown
#function to set the next y value
def new_y_value():
time.sleep(1/(plotHz * Oversample))
return Adafruit_ADS1x15.ADS1115().read_adc(0, gain=16)
def animate(i):
#add a new y value, and remove the first
totaly = 0
totalx = 0
count = 0
for j in range(secondsCalc * plotHz * Oversample)
totaly +=new_y_value()
totalx +=time.time()-startTime
count+=1
if count == Oversample:
allY.append(totaly/Oversample)
allX.append(totalx/Oversample)
count = 0
totalx = 0
totaly = 0
while len(allY) > (secondsShown*plotHz):
allY.pop(0)
allX.pop(0)
ax1.clear()
ax1.plot(allX,allY)
ani = animation.FuncAnimation(fig, animate, interval=1)
plt.show()
Step 14: After creating your code, click on “File” and then “Save as” to save the code that you have written so that you can come back to it and run the code whenever you want!
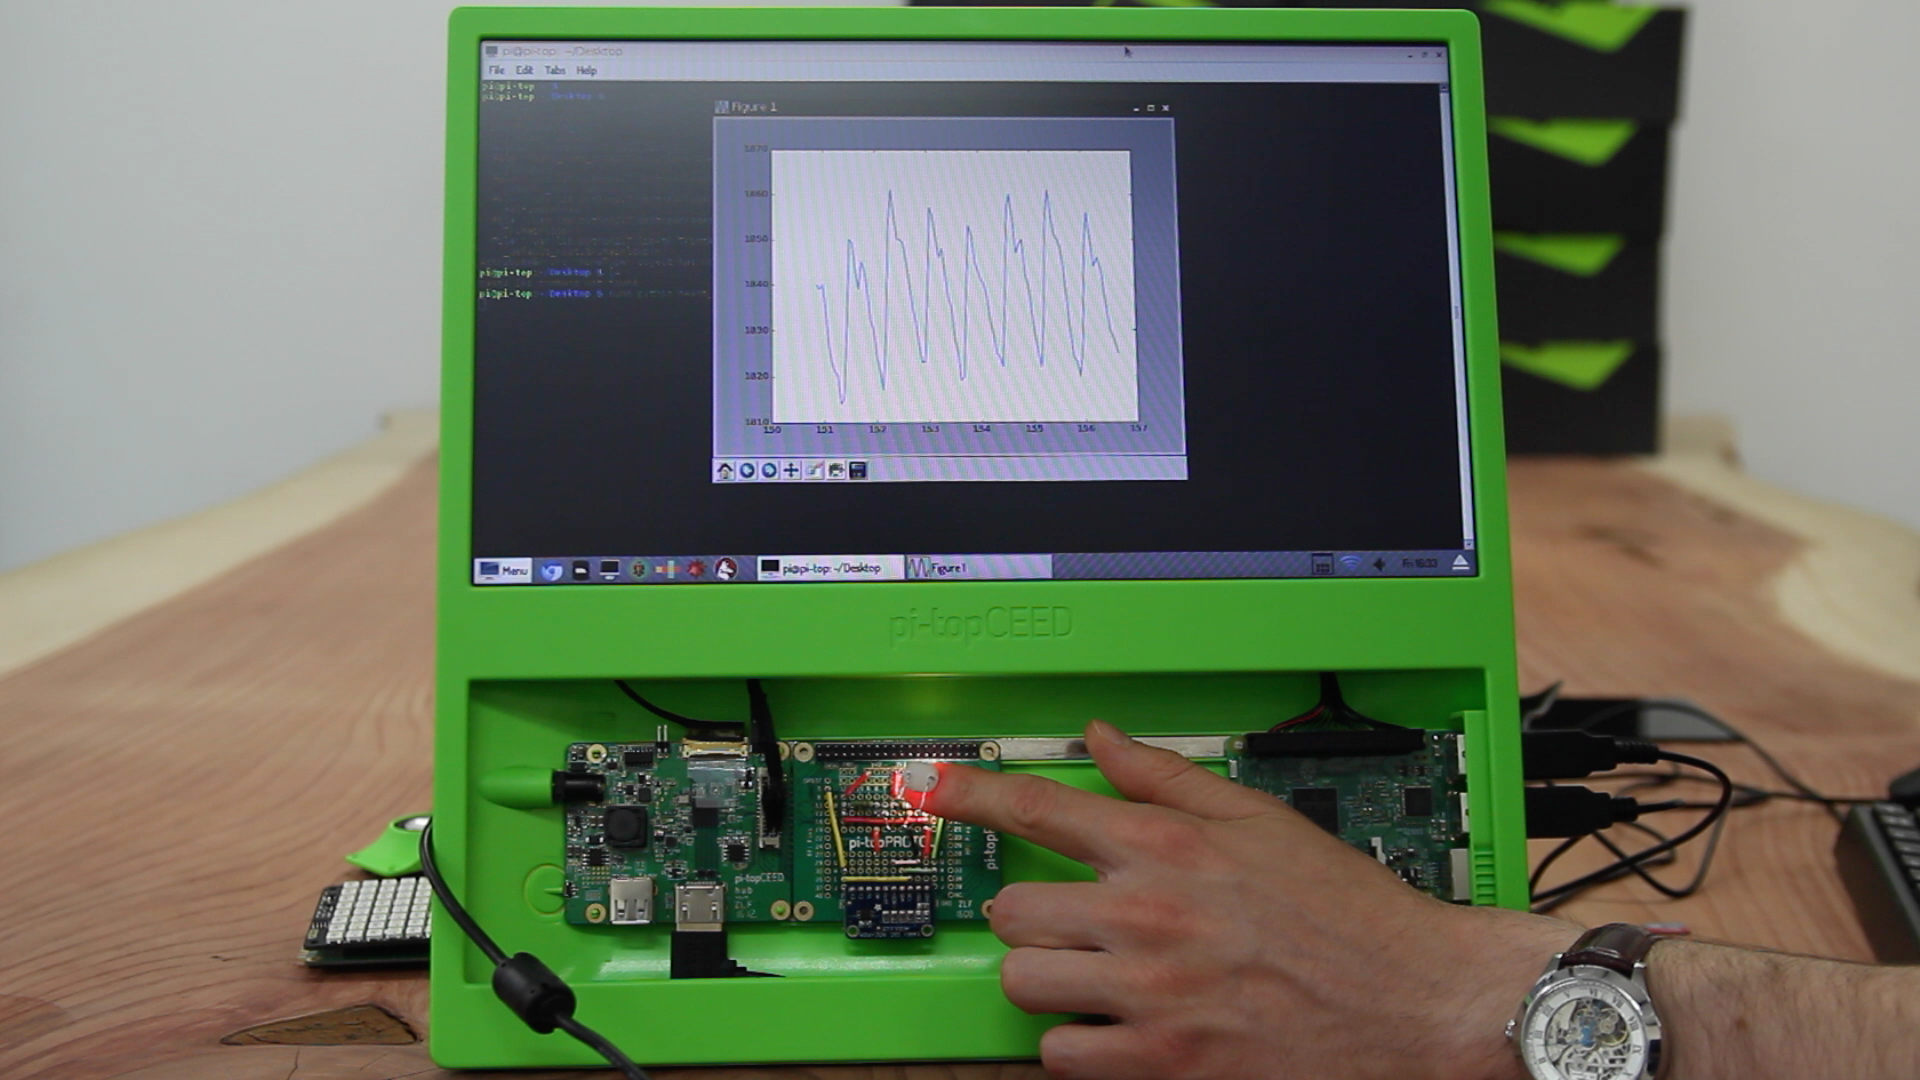
Step 15: After saving your code, put you finger in between the LED and the LDR and press F5 to run your code and see your heartbeat displayed across the screen as seen in the image below!
